Are you satisfied with your organization’s approach to talent analytics? If so, congratulations! You are likely part of the 8%(!) of respondents in Deloitte’s 2024 Global Human Capital Trends report who responded their organization is doing “great things” when asked where their organization is on its journey to “seeking better ways to measure worker performance and value beyond traditional productivity.”
Send me a note – I’d be excited to learn more about how your organization remains head and shoulders above its peers.
What’s Keeping You from ‘Great’?
For those in the majority, 92%, the reasons behind your lesser satisfaction with analytics can feel uniquely complex and, at times, overwhelming—you are hardly alone.
In 2021, AI-analytics platform Thoughtspot boldly declared “Dashboards are Dead,” finding that 67% of executives “aren’t comfortable accessing or using data from their existing tools and resources,” and a whopping “84% of frontline workers [reporting] a poor experience with analytics solutions and difficulty accessing data and insights”.
Today’s Reality: ‘Do More with Less’
These findings echo similar conversations I’ve had with scores of business users across functions in and outside of the HR/People space. I’m certainly an advocate for better solutions through technology. However, the current harsh reality for many people leaders includes:
- Budget cuts
- A shrinking workforce
- The expectation to ‘do more with less’
If this describes your situation, I’d like to share a practical example of how I’ve successfully supported teams by improving the quality of their analytics. At the same time, I helped reduce the cost of time, tech, and manpower needed to support the new solution.
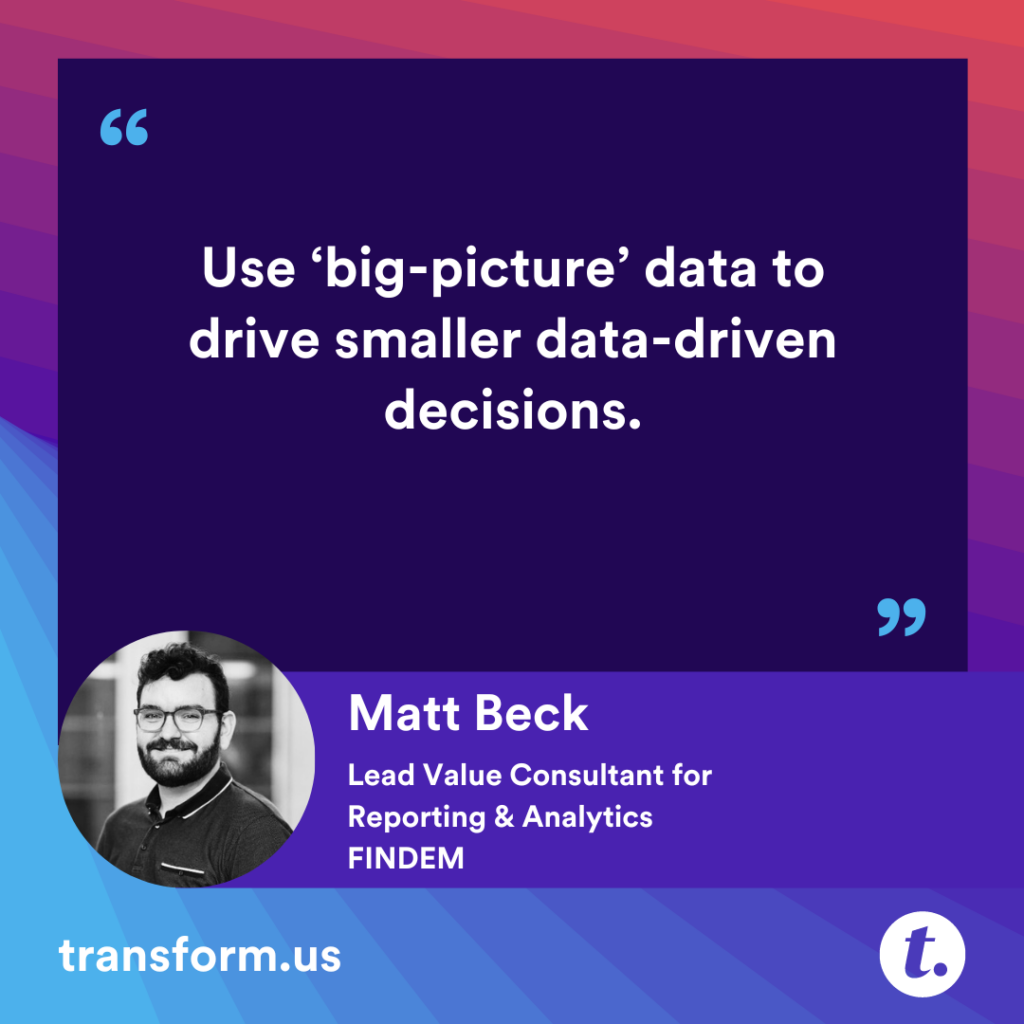
Using ‘Big-Picture’ Data to Focus Smaller Data-Driven Decisions.
I once had the opportunity to recommend improvements to the ‘team performance’ segment of the organization’s quarterly business review.
The problems, according to the team: “the meeting is too long, there are too many people involved in presenting the data, and team leaders report the meeting isn’t leading to valuable discussion.”
As I observed the next quarterly business review, I jotted down two words – information overload.
We had a metric for everything. From average time-to-fill to voluntary attrition, we tracked it all, presented in a deluge of slides filled with counts, rates, and charts. Each slide was read aloud, time was given for questions (there weren’t many), and then it was on to the next slide.
The problem wasn’t the data quality but rather the noise it created. We were so busy collecting and analyzing data that we had forgotten the most important question: What are we trying to achieve?
Going from Noise to Signal
I shared my findings with the Chief People Officer and received their endorsement to move forward with a simplified approach. The support of top leadership ensured that team leaders were transparent and willing to collaborate on the new process.
When I posed the question “What are you trying to achieve?” in one-on-one discussions with each leader, they were ready to dive in on the current goals of their department.
Once we were aligned on that first question, we then listed past and desired future metrics that could track their team’s efforts to achieve these goals.
I proposed that in order for a metric to be considered relevant for a business review, the metric needed to be a) measurable across multiple periods within the year and b) have a target or benchmark that determined ‘success’.
Finally, I asked each leader to recommend no more than 3 metrics from this list that they considered most important to achieve that year’s business and department goals.
A Big Picture View
From this ‘top 3’ metric set, I was ready to create a new approach to reporting. This view prominently featured a single ‘big picture’ metric that became the bedrock of the business review: Percentage of key metrics at or above target.
Right below, I presented the top drivers (both positive and negative) that had the most impact on the ‘big picture’ metric. Finally, I visualized how each team leader had achieved on-target performance across the year.
This report became the basis for the upcoming business review.
This change in the process had a major impact on both the productivity of this key meeting and on the time and effort required to collect and report on the data.
Collaboration and Focus
What was previously a week-long collaborative effort across several teams could now be collected, presented, and shared within one business day. This segment of the quarterly business review had transformed from a frustrating multi-hour presentation of ‘here are the numbers’ into a focused, lively discussion around how well the organization was tracking towards achieving its goals.
Leaders were now able to easily speak to areas of excellence and areas of opportunity. Each leader understood their contribution to the ‘big picture’.
As these leaders grew in confidence, I witnessed them evolve from being ‘data-driven’ to acting as strategic decision-makers empowered by their analytics.
My Recommendation:
Use ‘big-picture’ data to drive smaller data-driven decisions.
- Align the business question: What do you need to answer?
- Create a list of metrics that could answer this question.
- Review the metric list based on relevance. It is trackable over time and has a measurable ‘target’ that defines success.
- Select a limited set (I recommend no more than 3) of relevant metrics per team leader as the primary focus areas.
- Roll up team-level performance into the ‘big-picture’ metric. This should be a direct answer to the original business question.
- Clearly and simply report on the ‘big-picture’ metric.
You Have What it Takes to be Great
I credit the success of this initiative to the culture of joint trust and accountability that the organization’s leadership had built with their analytics function and the willingness of each leader to thoughtfully advise on what mattered most to their team’s future achievement.
To those in the 92%, I invite you to consider that meaningful improvement to your analytics strategy is achievable, even essential, to your organization’s success. It does not require additional budget. It does require a willingness to look beyond ‘how things are done’ and an alignment at all levels of leadership to make the change.

About The Author
Matthew Beck is the Lead Value Consultant for Reporting & Analytics at Findem. He has earned a reputation as an effective leader, relentless innovator, and authentic partner in the HR space, with ten years of experience empowering strategic decision-makers with innovative data solutions tailored to their needs.
Join us in engaging conversations and community as we transform the now and next of work, together at Transform 2025.